Create a Forecast
You can make predictions about the future performance of your business based on past data by using one of these time series forecasting methods: Trend, Growth, or Autoregression.
TERMS OF USE
The forecasting methods utilized in the Forecasting Function are based on the statistical analysis of historical information drawn from underlying data sources. The accuracy of the forecasted values is subject to many variables, including the accuracy of the underlying historical data and external events which could affect the validity of that underlying historical data for forecasting purposes. The Forecasting Function is to be used only as a guide of the future values for the measures being forecasted and is not intended to be used as the basis for complex financial or business decisions.
Cognos ULC (formerly Cognos Incorporated) makes no representations as to the accuracy of the actual future values and does not guarantee any specific results. You use the Forecasting Function and the data it generates at your own risk. The Forecasting Function may contain errors or produce inaccurate calculations. You accept the Forecasting Function and the documentation "AS IS". IN NO EVENT SHALL COGNOS ULC BE LIABLE FOR DAMAGES OF ANY KIND INCLUDING, WITHOUT LIMITATION, DIRECT, INDIRECT, INCIDENTAL, PUNITIVE OR CONSEQUENTIAL DAMAGES, RESULTING FROM THE USE OF THE FORECASTING FUNCTION OR THE INTERPRETATION OF THE DATA RESULTING THEREFROM.
For more information about the formula for each forecast method, see Forecast Formulae.
Trend (Linear or Straight Line)
The trend forecasting method  is based on the linear regression technique of time series forecasting. Trend forecasting gives the best forecasting reliability when the driving factors of your business affect your measures in a linear fashion. For example, when your historic revenue increases or decreases at a constant rate, you are seeing a linear effect.
A multiline plot of historic data should look linear or close to linear for greatest reliability. For example, if you are forecasting revenue for the next two quarters based on revenue for the past four quarters, and if the multiline plot of past quarterly revenue is linear or close to linear, then the Trend method gives you the best forecasting reliability.
Use the Trend forecasting method, for example, when you have only two data values representing two time periods in your historic data.
Example
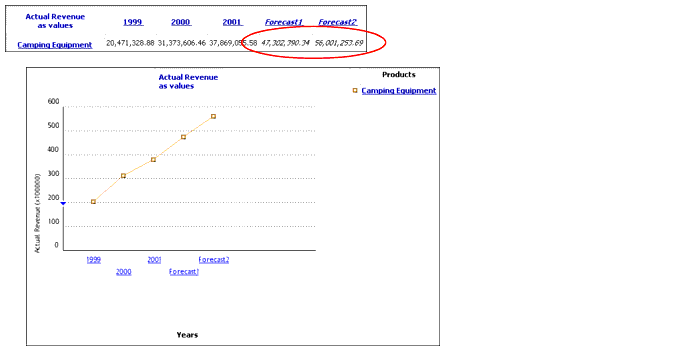
You are the sales manager for your company. You want to see what the overall revenue trend for the next two years is for Camping Equipment.
This report shows you that in the Camping Equipment line, the trend for the next two years is increasing revenues.
Growth (Curved or Curved Line)
The Growth forecasting method  is based on the exponential regression technique of time series forecasting. Growth forecasting gives you the best forecasting reliability when the driving factors of your business affect your measures exponentially. For example, when your historic revenue increases or decreases at an increasingly higher rate, you are seeing an exponential effect.
A multiline plot of historic data should look exponential for best accuracy. For example, if your revenues are growing exponentially due to the introduction of a best selling product, then Growth forecasting will provide a more reliable forecast than the Trend method.
Example
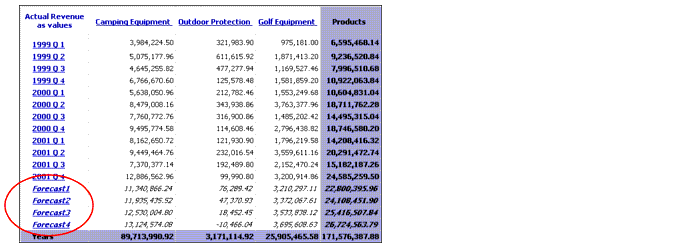
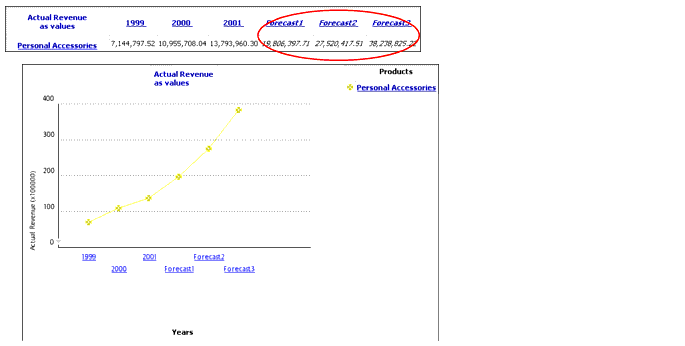
You have hired two additional sales representatives for your company. To allocate your new resources effectively, you want to know which product line has the greatest growth potential.
This report shows you that your new resources would best be assigned to the Personal Accessories line, which has the greatest revenue growth potential.
Autoregression (Seasonal)
The Autoregression forecasting method  is based on the auto-correlational approach to time series forecasting. Autoregression forecasting detects the linear, nonlinear, and seasonal fluctuations in historic data and projects these trends into the future. Autoregression provides the best forecasting reliability when the driving factors underlying your business are affected by seasonal fluctuations.
A multiline plot of time and revenue will show up-and-down fluctuations that may reflect seasonal variations. For example, if your revenues are growing exponentially due to the introduction of a best selling product, but sales of that product are also seasonal, then Autoregression forecasting will provide a more reliable forecast than the Growth method.
Use the Autoregression method when you have historic data representing a large number of time periods (for example, more than 24 monthly periods) and when seasonal variations may occur in it.
Example
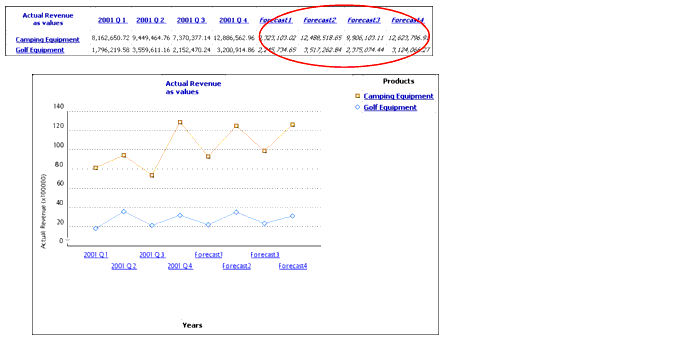
You are concerned about the Camping Equipment and Golf Equipment forecasts for the next two years. You want to know the forecasted revenues, adjusted for seasonal fluctuation, for each of the next four quarters.
This report shows that the forecast for both lines, when adjusted for seasonal fluctuation, continues to follow the same pattern and maintain revenue totals.
You must have the time period shown as either rows or columns in your crosstab to create a forecast.
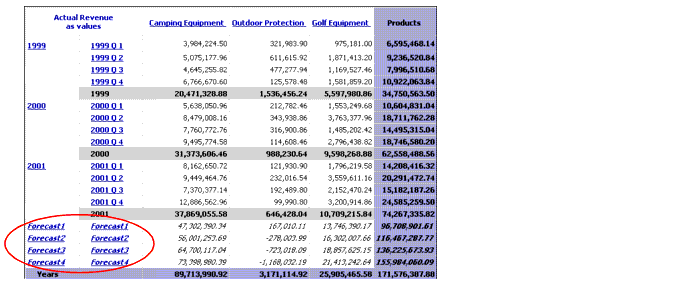
If you nest multiple levels of time in your crosstab, PowerPlay Web produces the forecast only at the highest level of time. For example, if you nest quarters within years for revenue and then insert a Forecast calculation, PowerPlay Web generates the forecast only at the years level.
To generate your forecast at the quarters level, delete the years level before you generate the forecast.
If you applied ranking in your crosstab, PowerPlay creates the forecast you request, however, forecasts are not included in the rankness.
If you convert the currency in your crosstab, PowerPlay creates the forecast on the currency-converted values.
Steps
- Right-click a time category in your crosstab display or graphic display, and then click Insert Calculation.
- In the Operation box, select Forecast.
- From the Forecast Method list, select the forecasting method you want to use.
The methods are Trend, Growth, and Autoregression.
- In the Forecast Horizon box, type the number of time periods to forecast.
- Click OK.
Tips
- To change the label of a calculation, right-click the label, and then click Rename Calculation. Type the new label in the Calculation Name box and click OK.
- To see the formula or categories used for a calculation, right-click the label, and then click Explain.
- Calculated values appear as na, or in scientific notation (for example, 1.7976931348623158e+308).
If the values appear as na, PowerPlay does not have appropriate values on which to base a forecast. If the value appears in scientific notation, the result is larger than 15 digits.
 is based on the linear regression technique of time series forecasting. Trend forecasting gives the best forecasting reliability when the driving factors of your business affect your measures in a linear fashion. For example, when your historic revenue increases or decreases at a constant rate, you are seeing a linear effect.
 is based on the exponential regression technique of time series forecasting. Growth forecasting gives you the best forecasting reliability when the driving factors of your business affect your measures exponentially. For example, when your historic revenue increases or decreases at an increasingly higher rate, you are seeing an exponential effect.
 is based on the auto-correlational approach to time series forecasting. Autoregression forecasting detects the linear, nonlinear, and seasonal fluctuations in historic data and projects these trends into the future. Autoregression provides the best forecasting reliability when the driving factors underlying your business are affected by seasonal fluctuations.